How to Debug Garmin Crash Reports
There’s a problem. Fix it.
Writing software usually comes with an element of support, this could be due to a of a lack of understanding on the user’s part, maybe a feature is being used in a way it wasn’t thought of during development, a user might want something specific, the developer could have introduced a bug etc etc… Regardless of the type of support request, developers need to collect the right information to be able to act appropriately.
The above are all examples of emails or reviews I’ve received while creating and releasing applications for Garmin devices, some are a little light on details, others barely qualify as sentences, all told this makes collecting the right information rather…difficult
Today, I’m going to highlight a small tool Garmin have provided which should help developers resolve application crashes with a lot less friction. The tool itself, known as Exception Reporting Tool or ERA, was actually released in the Connect IQ 3.1 beta back in April 2019, however I only became aware of it recently. I figured there might be others out there who have yet to discover it, maybe this post proves useful for someone.
Ok great, do you mind sending some more info?
Before we get to the ERA tool however, I think it’s kind of interesting to see where we’re coming from, if you’re not interested in a brief history lesson, head on over to The future is here, the future is plain(ish) English.
Prior to the introduction of the ERA tool, if you wanted to find the crash report from you Garmin application you had to
look for the CIQ_LOG.YAML file that was written or updated on the device filesystem, /GARMIN/APPS/LOGS. If your device was
running a CIQ version older than Connect IQ 3.0, you’d be looking for CIQ_LOG.TXT. This resulted in more than a few emails
that went something along the lines of
If you also forward your crash logs I can take a look, the following file will contain what I need
- CIQ_LOG.YAML found within the /GARMIN/APPS/LOGS directory within the watch filesystem.
Thanks! Now to translate this output into something halfway useful…
Typically responses would include the file I was after, but the contents weren’t exactly shining a spotlight on the issue
|
|
From the above, I knew which application was downloaded. I also had a vague idea which version the user was running.
|
|
The problem here is that Store-Version is incremented on each release, so I knew this was the 15th release of the Horizon
application, but what actual version of the codebase that translated to would be impossible to know unless you were keeping
your semver versioning in line with or referencing store releases.
Moving on, I also had some information about the CIQ version on the user’s watch, as well as their firmware, but not their watch model…
|
|
And while I technically had the details of the crash as well as the type of error and a stack trace
|
|
The provided stack trace doesn’t really point me to anything right away, you see the stack trace is presented in
a HEX format. In order to be remotely useful, this had to be converted to decimal format. Taking the first line of the
stack trace would result in a conversion from 0x100010b2 to 268439730. Still about as clear as mud.
After conversion, you had to then find the closest line number in your application’s debug file, to point you in the direction of where the error was occurring. That’s right, the conversion wouldn’t highlight the line in the code where the error occurred, you had to use the information and find the error based on the closest line according to the your debug file.
So, open up the Horizon.prg.debug.xml, start searching for 268439730, find nothing, start removing digits from the end
of the string until a match is found, something similar to this:
|
|
And it’s at this point that you’ve finally got any idea as to what might be going wrong. Unsurprisingly, having to do this this for multiple reports and apps is a relatively painful process.
The future is here, the future is plain(ish) English
Enter ERA! The tool itself can be launched either from the command line
era [-a <arg>] [-k <arg>]
Where -a is your AppID and -k is the key file you used to create the app.
Alternatively (and the way I use the tool), you could launch it from the Eclipse menu
Connect IQ -> Start ERA
On first start up you’ll need to add your developer identity which is a case of entering your developer ID and developer key.
https://apps.garmin.com/en-US/developer/5bfb3073-ce07-4509-bcae-771c5bef197e/apps then the developer ID is 5bfb3073-ce07-4509-bcae-771c5bef197e.Once you’ve done that, you should find you have access to all the apps you’ve released via a dropdown menu
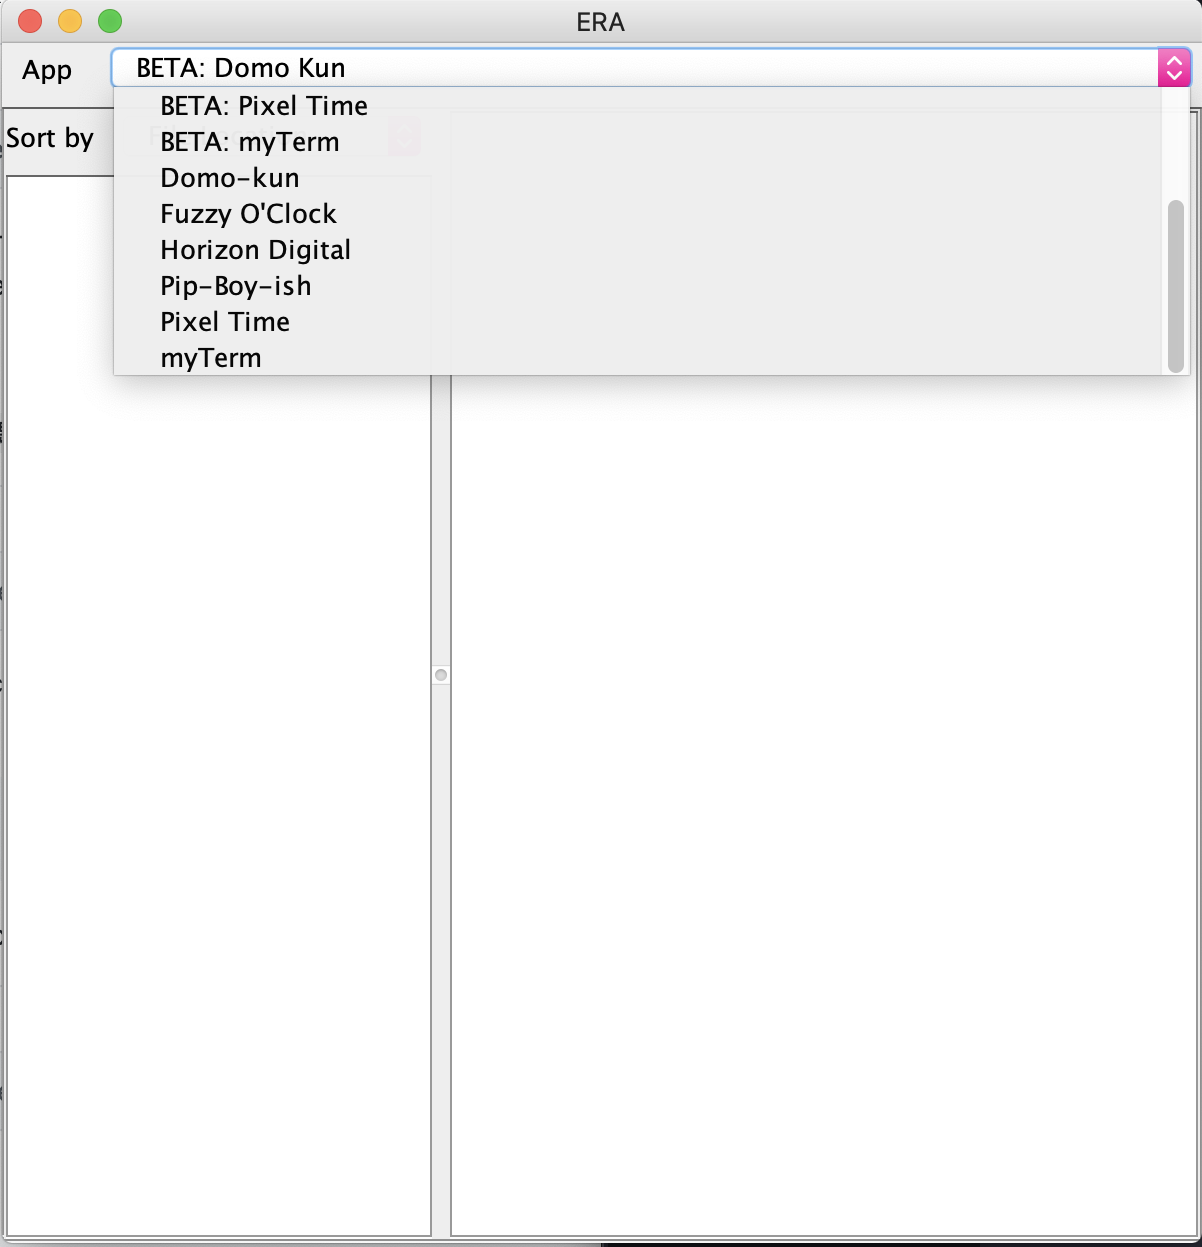
Clicking on one of them, will display any and all crash reports associated with the app
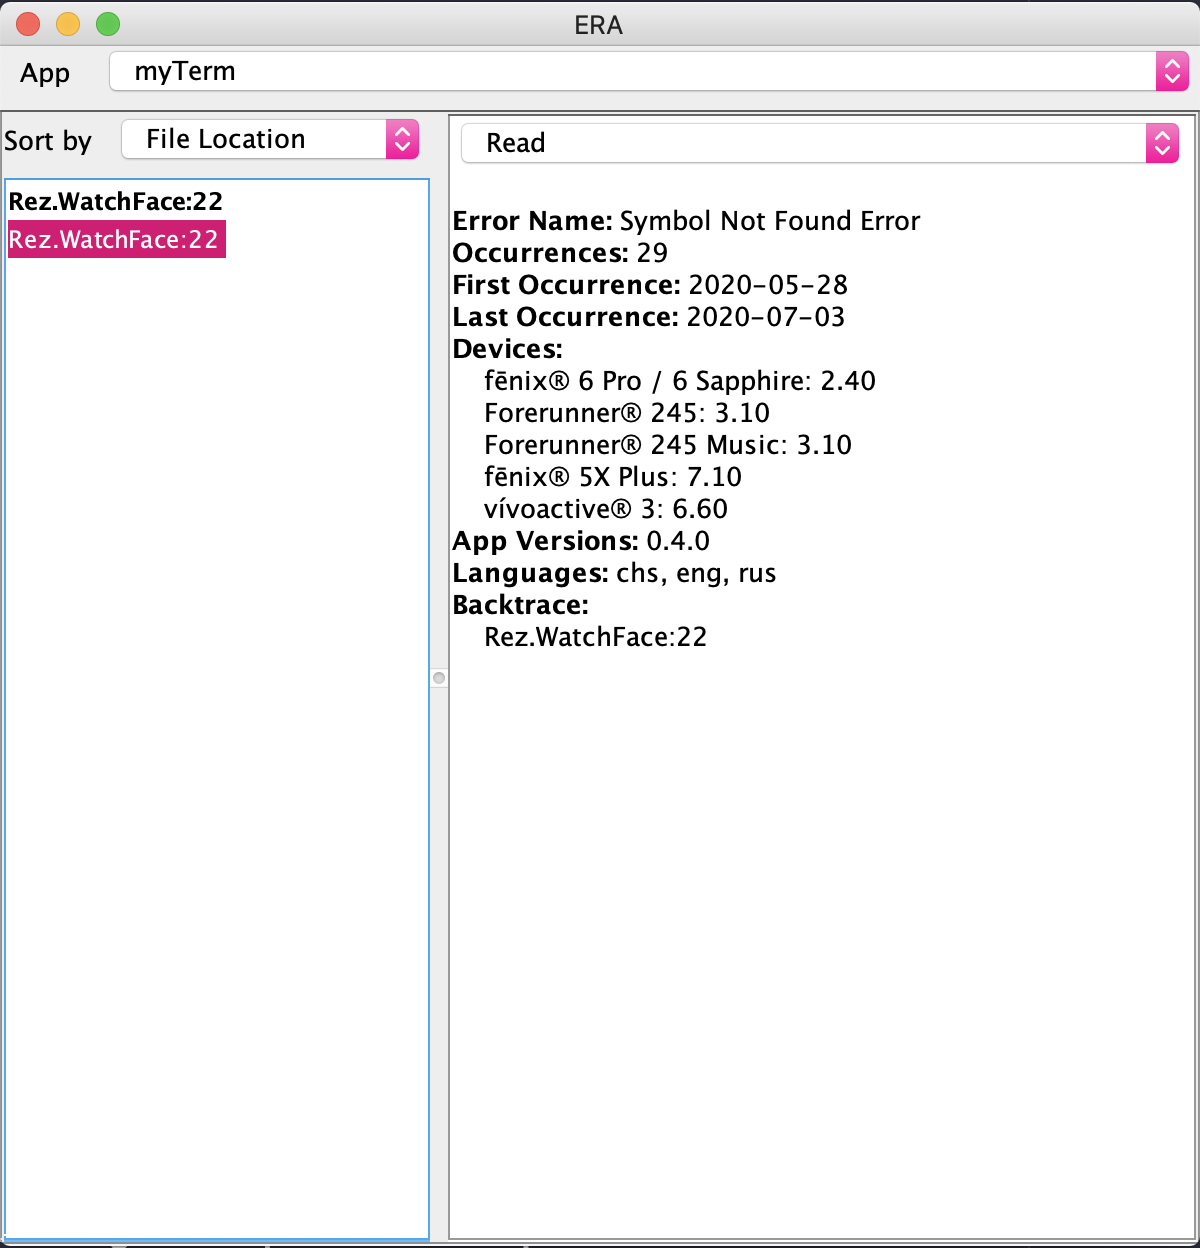
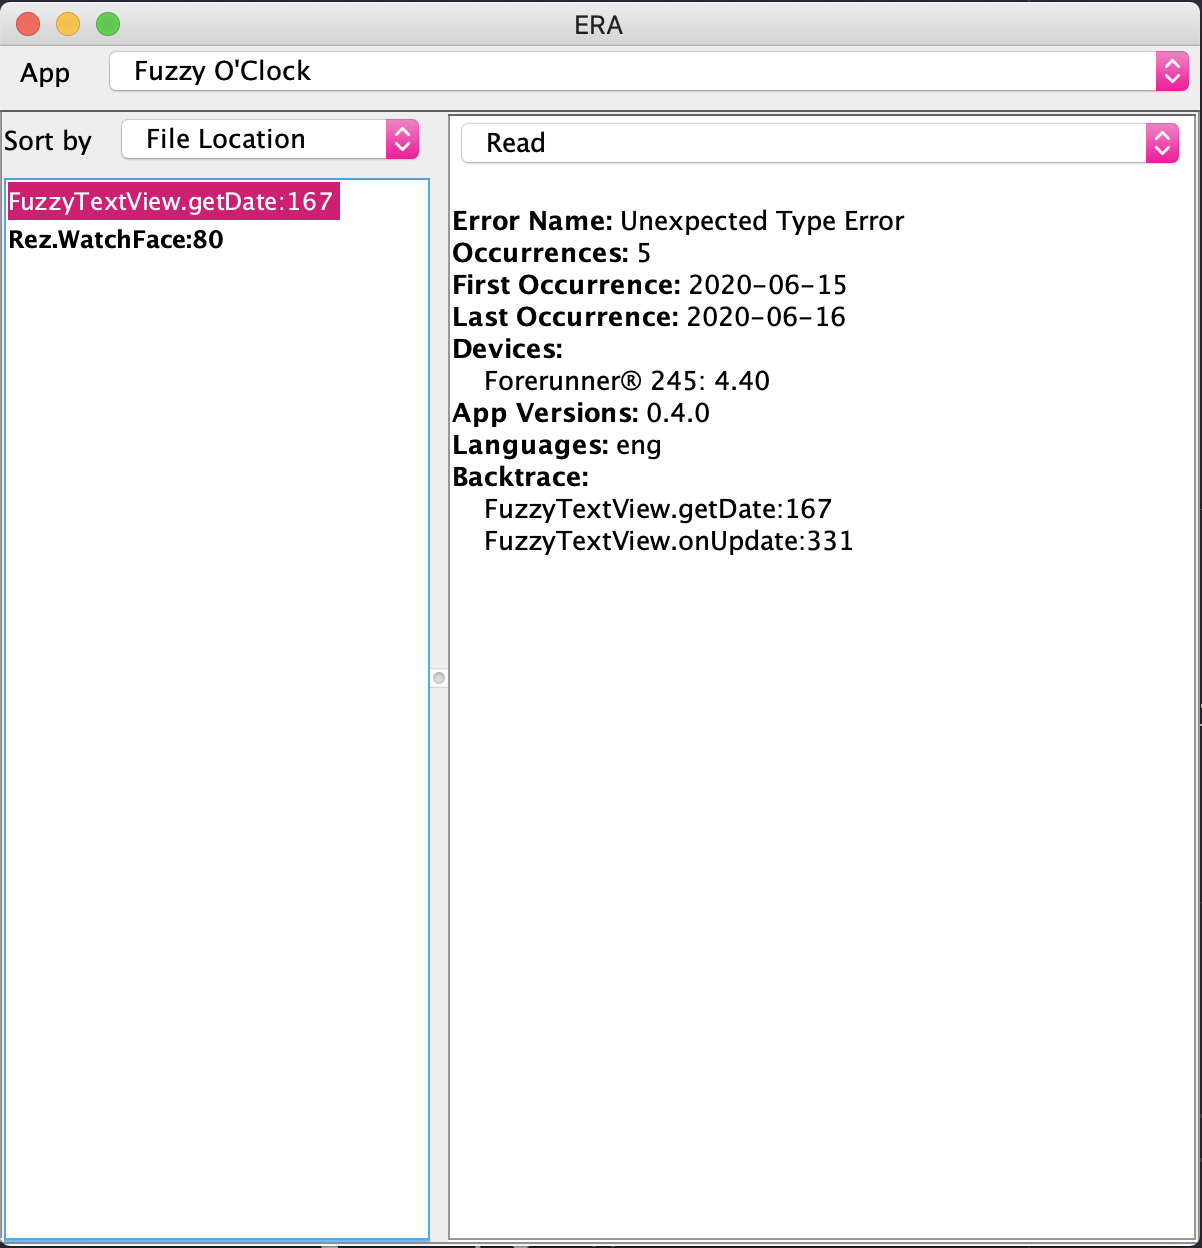
Right away, it’s clear that the reports are presented in a much better format for developer.
- For a start they’re in plain(ish) English, you’re provided with the line of code where the error is happening.
- On top of that, being an anonymised crash reporter you get information from all users rather than only those who reach out to report a crash.
- Additionally, you get an occurrence count so that you’re able to focus on resolving the most common crashes first.
- You’re told the model of the watch which experienced the crash as well as the firmware version.
- Interestingly, the CIQ version is omitted now though.
- Finally, you’re given the real version of the app which is experiencing the crash rather than the
Store-Version.
All in all, this has made debugging applications so much easier and it has made it possible to make this a proactive process which results in a better experience for developers and users alike.
And with that, it looks like I have a few crash reports to solve 😅. Thanks for reading.